It’s a romantic notion that exists in every human endeavor – the clutch player. In basketball he’s the guy you want taking the game-winning shot. In sales he’s the guy you send in to close the deal. In baseball the guy you want on the plate with the bases loaded and two men out in the 9th. But what does being a clutch player really mean? Because we’re not just talking about the best player on the team, we’re talking about the guy who can make the difference when the chips are down. That is to say, the guy who doesn’t just perform ‘well’ but actually elevates his game in high pressure situations.
Do clutch players exist in tennis? Let’s find out!
Those numbers geeks among you can find the methodology explained at the bottom. For everyone else let’s dive right in. The table below shows a select group of the top 30. The first column shows the percent of the time the player wins non-break points on their own serve. The second column shows how often they win the point on their own serve on break points. The last column shows the difference. A positive number is good, a negative number is bad. In theory, a clutch player will win at least as many points on break points as they do normally, and a true clutch player will actually win points at a higher rate on break points than normal points. So who are the clutch players at the top of the tour? You might be interested to see just which names come to the fore…
The Clutch Players
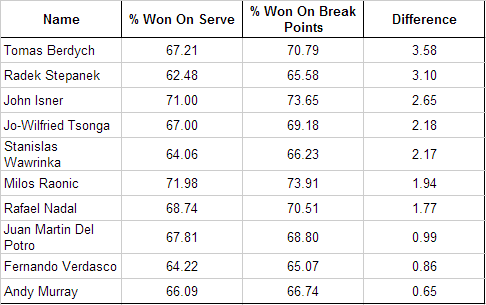
For most people when they think of clutch tennis players, Berdych and Stepanek are not the first names to come to mind. However that’s what the stats show – both of them are more likely to win a break point than a regular one. That is, when break point comes they step their game up a notch. They are not alone however. Isner, Raonic, Nadal, Tsonga and a handful of others join them. And typically we can split them into two broad categories.
Daydreamers
One of the reasons we don’t expect to see Berdych at the top of the list is that he has a reputation for mentally wandering off during matches at times. Tsonga is much the same way – for all his talent he can get distracted on occasion. Verdasco could be accused of this also. So why do they up their game on big points? Because the appearance of a break point serves as a focusing mechanism for them. Under the pressure they have cause to bring their full attention to the point at hand, and in doing so perform better than on average when they are less likely to be concentrating properly.
Big Servers
This idea of clutch big servers has become a part of tennis culture. Sampras, Ivanisevic – players who could step up and ace their way out of trouble are legends of the game. It’s no surprise to see some huge servers near the top of the list. Raonic, Isner, del Potro are all big guys with big serves who can take break points entirely out of the hands of their opponents.
Warriors
Some people are just contrary by nature. Nadal and Stepanek both have reputations as combative players. Nadal dances around and stares his opponent down over the coin toss. Stepanek flexes what passes for his muscles after winning big points. These are guys who thrive off the conflict, and nothing gets their back up more than break points. It’s a psychological spur – not that either are prone to wandering concentration. Rather the specter of getting broken pushes them up a gear and brings out their best.
Of course there are some big names missing from the list of clutch players. So let’s take a look at the ‘chokers’ out there…
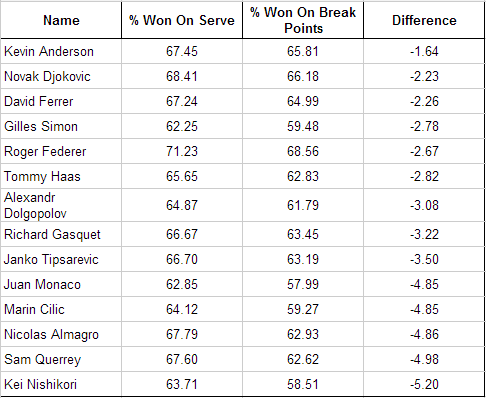
The first thing that stands out is that so many of the top players underperform on break points. And for some of them it isn’t just a small drop in performance that could easily be explained away by luck. Kei Nishkori’s chances of winning the point on break drop by a full 5%! That’s not a dip in performance – that’s a valley. But Nishikori isn’t the only culprit. Cilic, Almagro, Querry and Monaco are all close behind him at roughly 5% also. While Dolgopolov’s flashy-yet-risky playstyle may rightfully land him on the list, it is shocking to see both Djokovic and Federer here. Two great champions with a history of winning big matches, and yet both drop their performance on break points.
The Divide
While the margins may not seem huge, they are significant. And what really stands out from them is that there is a clear divide between the way players respond on break points. If it were truly random chance, we’d see a fairly even spread across the entire spectrum – which would also include a collection of players right around their normal average +-0.5%. Yet in all of the players we examined, not a single one of them fell in this range and well over half the players had a clear negative split on break points compared to their normal service points.
Tennis Legends
After completing all of the above work I was struck by an interesting thought: how do the legends of yesterday compare to those of today? Wouldn’t it be interesting to see how a player like Pete Sampras stacked up on the pressure points? How about Boris Becker or Stefan Edberg?
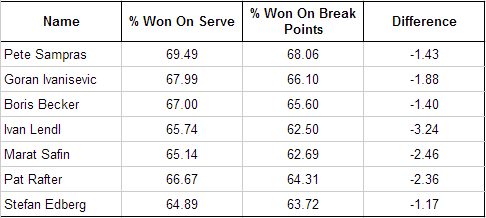
Surprising isn’t it? As it turns out Pete wasn’t such a clutch player after all. His performance didn’t drop precipitously, but it didn’t elevate either. Pete had the reputation of a guy who would step up and serve three aces if he got down love-40. As it turns out, he’d pretty much just do his usual thing, give or take about 1.5%. Now granted the stats for these ‘legends’ are across their entire careers, which makes them both statistically more significant but also encompasses periods when they were not at their peak. Regardless the data is interesting.
Small Numbers Mean Big Things
Many readers might glance at the numbers above and comment that they are small. And yes, a 2% difference on break points isn’t earth-shattering. However the margins in tennis, especially these days, have become exceedingly small. In some cases 2% in certain categories is all that separates multiple grand-slam winners from guys who barely cracked the top 10. Across a career, 2% can be the difference between playing on the legends tour and becoming a local teaching pro. Let’s take a moment and put the difference in perspective.
On our list Richard Gasquet was among those who dropped his performance by 3% on break points. Let’s consider if he had raised his level on break points instead, like Berdych. Across the course of 2012, if Gasquet had lifted his level by 3% on break points instead of dropping it by 3%, he saves 19 more break points. We all know the difference even a single break can make in a match – in a season where you only play 64 matches as Gasquet did last year, holding serve 19 more times is kind of a big deal. Now granted saving 19 more break points doesn’t necessarily equate to 19 more holds. But for Gasquet, it takes on average three break points to obtain one break against him. So across the season those 19 break points saved do equate to either 12 or 13 more service holds. That’s still a big number.
What does this tell us?
1) The pros get nervous too. They get scared, tentative, feel pressure and it can affect their play, just like the everyone else.
2) Break points make a difference one way or the other. Anyone who claims they treat break points the same as any other point are probably wrong.
3) Clutch players are very real – consider that the spread difference between the top and bottom of our list is more than 8%. That’s a big number.
Sabermetrics is truly an under-explored area of tennis. We can use statistics to test and confirm popular tennis myths. Do big servers really tend to have better tie-break records? What are the most important factors for becoming a top 10 player? There’s a lot of truth hidden in the data. The trick is finding ways to tease it out. To truly expand our knowledge of tennis however we may need to see a shift in the way statistics are kept at professional tennis events. Valuable information is being left on the court due to the overly simplistic way of thinking that we perpetuate when we try to analyze tennis matches. At some point in the next few weeks we’ll take a look at exactly what statistics the ATP should be taking in addition to the ones it already does.
WARNING: Math Stuff Below!
Adding this in because I realize I forgot to explain how I got the numbers. Most people may not care, but for those inclined…
The first thing was getting the raw numbers off the ATP website. I tracked down total number of points won on first serve, total points won on second serve, break points faced, break points saved. – For the average point win % I added the total points won on first and second serve, and subtracted out the break points saved. This gave us the total number of points won on serve on points other than break points.
– For total normal points played on serve I added together points played on first and second serves, and subtracted out the break points faced. This gave us the total number of points played on serve other than break points.
– Dividing the result from step 1 by the result from step 2 gave us the % of points won on serve points other than break points.
– To get the break point saved % I divided the number of break points faced by the number of break points saved. The ATP has a % posted, but they round up so the number you get from them could be off by as much as 0.5% which is a big deal.
– To get the difference, I subtracted the % of points won on serve on non-break points from the % of points won on break points.